The consumer research journey has always been a sequence. Someone becomes aware of a brand — through a TV ad, a social post, a display unit, a word-of-mouth recommendation. They enter a consideration phase, gathering information, comparing options, reading reviews. They develop intent and eventually convert. Attribution exists to assign credit to the touchpoints in that sequence.
Generative AI assistants are automating the middle of that journey — and doing it invisibly. When a consumer asks ChatGPT to compare SUV brands, or asks Perplexity to summarize financing options, or uses an AI assistant to research pharmaceutical options, that entire research session produces no analytics signal. There is no impression, no click, no referral. The journey happened; you just can't see it.
This is not primarily a content strategy problem or an SEO problem, though it is both of those too. It is a marketing measurement problem — and it is coming industry by industry, at different speeds and in different forms, depending on how deeply research was already baked into the category. What follows is a framework for where it's already arriving and what it will require of attribution infrastructure when it does.
The ORAC Lens on What AI Does
C3 Metrics classifies every touchpoint in a consumer journey by its functional role: Originator (first introduced the brand), Roster (maintained visibility during consideration), Assist (actively moved toward conversion), and Converter (present at the moment of purchase). Standard attribution models assign credit; ORAC classification assigns role. The distinction matters because role determines strategic value — a channel that originates 60% of converting journeys deserves a very different budget decision than a channel that converts 60% of journeys that were already going to convert.
What AI assistants are doing, at scale and with increasing sophistication, is absorbing the Originator and Roster functions of the consumer journey into private sessions that leave no measurable footprint. A consumer researches your brand inside a ChatGPT conversation. They form a preference. They leave the session and, days later, search your brand name on Google and convert. Your attribution model sees: brand search → conversion. It credits the Converter. The actual Originator — the LLM session that generated the preference — is invisible.
This is a structural problem, not a data quality problem. No additional tagging, no server-side collection improvement, no cookie will solve it. The data doesn't exist to collect. The conversation happened in a closed system.
It Makes the Existing Problem Worse
The over-crediting of brand search and last-click converters is not a new issue. In every attribution program that has moved from last-click to multi-touch, the credit distribution for paid brand search drops substantially — because the journey analysis shows that brand search is almost always a Converter, not an Originator. The consumer was already going to buy; the brand search was how they returned to complete the purchase. The channel that should receive Originator credit is typically much further up the funnel: TV, upper-funnel display, a content touchpoint that first surfaced the brand.
AI-compressed journeys accelerate this distortion sharply. As a larger share of Originator activity moves into LLM sessions — private, untracked, without any referral data — the channels that remain measurable are disproportionately the Converters. The measurement environment becomes more last-click by default, not by design. Budgets optimized against that signal will flow toward Converter channels. Originator channels — the ones that created the brand preference that the AI session then reinforced — get cut. The pipeline eventually empties.
The behavioral logic is observable in what little referral data does exist. Consumers who click through from an AI citation arrive with a formed preference, not an open question. The research happened inside the AI session; the click is the Converter event. You see the end of the journey, not the journey itself. Claims about exactly how much better this traffic converts vary widely by source — and critically, most of the sources making large claims have financial interests in validating AI's performance. The directionality is real; the specific multiples should be treated skeptically until measured independently within your own programs.
The Industry Asymmetry
The urgency of the AI attribution problem is not uniform across categories. It scales with how deeply research was already embedded in the consumer journey — and how much of that research was previously generating measurable signals.
Automotive is the clearest current case. Endemic research behavior has always been a defining feature of the category: buyers spend weeks comparing on Edmunds, KBB, manufacturer configurators, and dealer sites before they ever contact a dealer. That behavior was always generating measurable touchpoints — third-party platform impressions, clicks, time-on-site signals. AI is now compressing and absorbing that research phase into LLM sessions. Cox Automotive data from 2025 found that 44% of auto buyers are already using AI tools during their shopping process. The Originator signal isn't disappearing from automotive journeys; it's moving somewhere it can no longer be tracked. The disruption is already in process, not on the horizon.
Financial services and insurance have similar endemic research depth, but a different attribution challenge: in those categories, the conversion event is predominantly offline — a phone call, an application submission, a branch visit. Attribution was already partially broken before AI arrived. AI adds an invisible layer to a journey that was already difficult to measure end-to-end, which intensifies the need for offline conversion integration, not just better digital tracking.
Categories with shorter consideration cycles — CPG, quick-service, subscription products — face a different version of the problem. In those verticals, there wasn't much of a digital research phase to begin with. A consumer deciding which protein powder to buy or which streaming service to try didn't leave a rich chain of pre-conversion touchpoints. AI may actually be inserting a new Originator phase into categories that previously had almost no top-funnel digital signal — creating AI-influenced consideration where there was previously a near-direct brand-to-purchase path. The attribution challenge there isn't about preserving signal; it's about building the infrastructure to capture something new.
The implication: a single response to AI's impact on attribution doesn't fit every category. The measurement priorities differ, and the timing differs. What's consistent is that the frameworks — ORAC role classification, BOS signal detection, new-vs.-returning segmentation — are the right analytical architecture regardless of which version of the problem a given program is facing.
The Sponsored Inclusion Question
The advertising industry has been watching AI platforms' approaches to monetization closely, because paid inclusion in AI results creates both an opportunity and a familiar conflict. The landscape as of early 2026 is more interesting than "ads are coming."
OpenAI launched advertising in ChatGPT in early 2026, implemented as clearly labeled sponsored results displayed below organic AI-generated answers — explicitly segregated from the organic response. Perplexity, after testing sponsored placements, explicitly abandoned the model in February 2026. Their stated reasoning was direct: if users believe ads can influence the answer, trust in the answer collapses. They chose the trust-first model and are building a merchant integration layer instead. Google is expanding advertising into AI Mode with its existing infrastructure already in place.
This divergence is meaningful. The platforms choosing organic trust over ad revenue are making a structural bet — that uncompromised recommendations are the long-term durable asset. The platforms building ad products are entering the same tension that has always defined platform self-reporting: a financial relationship with the channels being evaluated creates pressure on the evaluation. Whether the pressure bends the answer intentionally or gradually doesn't change the structural problem.
The measurement implication is layered. As paid inclusion scales in some AI platforms, attribution models will need to distinguish AI organic (earned citation) from AI sponsored (paid placement) — the same distinction MTA makes between organic and paid search. These are different signals with different cost structures, different intent profiles, and different credit implications. For now, that distinction isn't being made in most attribution programs, because AI as a channel is still being established. But the architecture to make it will need to exist before the spend scales.
The Agentic Conversion Problem
The research automation case — AI handling discovery and consideration — is the present challenge. What comes next is agentic conversion: AI agents completing transactions on behalf of consumers. This is no longer entirely theoretical.
OpenAI launched in-chat purchasing with Instacart in December 2025, followed by integrations with Target and DoorDash. Perplexity's "Buy with Pro" has been live since late 2024 and expanded to free users by late 2025, with access to 5,000+ merchants. Consumer adoption at scale remains early, but the infrastructure is shipping faster than expected.
When a consumer instructs an AI agent to "book a test drive at the nearest dealer" or "find me the best available rate and apply," the conversion event happens without a human user journey. There is no click path. There is no site visit. There is an API call from an agent to a booking system, and a conversion that your current attribution infrastructure has no mechanism to capture. The standard MTA pipeline assumes a human consumer navigating a browser, leaving behavioral signals at each step. Agentic conversions break that assumption at the most fundamental level.
The practical response requires measurement at the agent request level: capturing the context of the AI agent interaction that produced the conversion request, not just the conversion event itself. The window to build that infrastructure before agentic commerce scales at volume is open now. It won't stay open long.
What Shorter Funnels Mean for MTA Models
Multi-touch attribution models are trained on path data: sequences of touchpoints leading to conversion. The statistical confidence of those models improves with path length and touchpoint diversity. A model trained on paths with an average of 8–12 touchpoints produces tighter, more reliable credit assignments than one trained on paths with 2–3 touchpoints, because there is more signal to work with.
AI-compressed journeys are shorter journeys. When the Originator and Roster phases move into private LLM sessions, the visible path shrinks. Fewer touchpoints mean less data per path. At scale, this degrades model confidence — not because the attribution methodology is wrong, but because the observable signal is thinner.
Two things follow from this. First, the segmentation between new and returning customers becomes even more important (see our earlier analysis of the new vs. returning problem). AI-influenced journeys are most likely for new customers in the awareness and consideration phase — the people who actually need to do research because they don't yet have a relationship with the brand. Returning customers already have brand knowledge; they're less likely to consult an AI assistant about something they've already decided. Mixing these populations in a single attribution model averages away the signal that matters most for understanding AI's impact.
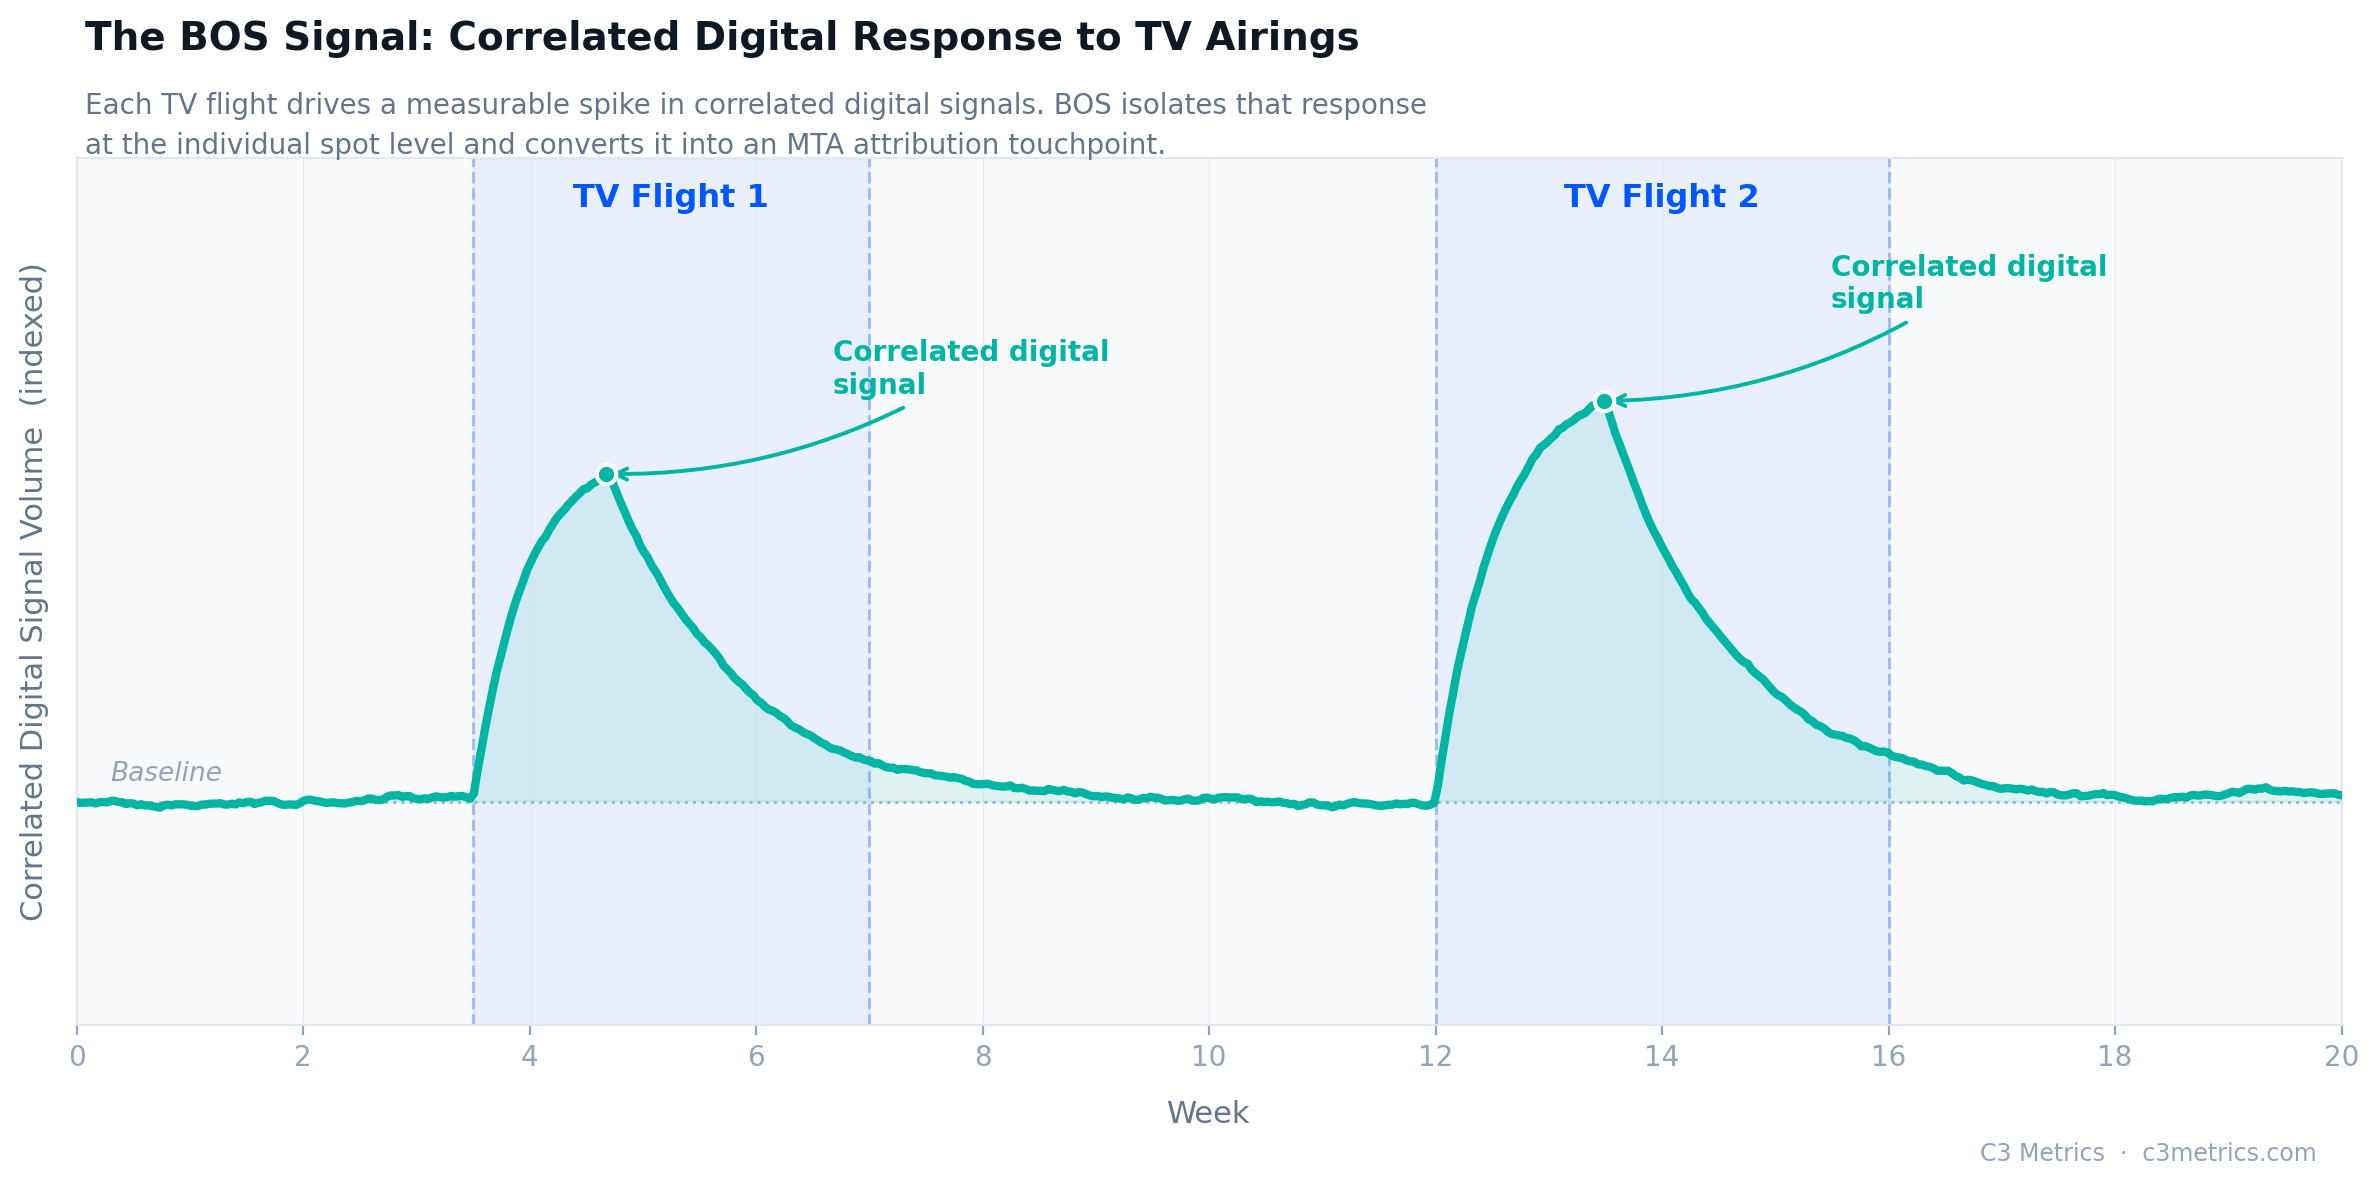
Second, the BOS signal methodology — which converts offline media exposures (TV, radio, OOH) into MTA touchpoints by tracking the branded search spikes they create — has a natural extension into AI attribution. When AI activity influences a consumer to search for a brand, that branded search is the measurable downstream consequence of an invisible upstream exposure. The same correlation logic that identifies TV-driven branded search spikes can identify AI-influenced branded search volume — not with certainty at the individual journey level, but statistically across program-level data. The branded search spike that follows a brand's appearance in a widely-distributed AI response is a signal, and it's measurable.
What Independent Measurement Protects Against
As AI platforms become advertising channels — which OpenAI's February 2026 launch confirms they are becoming — the structural conflict of interest argument applies again with greater force. A measurement partner with commercial relationships with AI advertising platforms has an incentive toward the same favorable attribution that has long distorted platform self-reported search and social metrics. The platforms with the most to gain from being credited for AI-influenced conversions are the most motivated to offer measurement products that show those conversions. The separation between who sells the media and who measures its effectiveness doesn't become less important as the media environment becomes more complex. It becomes more important.
There is a subtler version of the same problem worth naming. When advertisers ask for guidance on how AI will affect their measurement, the answers they receive will reflect the interests of whoever provides them. A measurement recommendation from a party with strategic ties to a major AI platform — or from an AI tool built by a company with its own advertising ambitions — is not a structurally neutral recommendation, regardless of whether the bias is intentional. Google's position, unsurprisingly, is that advertisers should consolidate measurement inside Google's ecosystem and trust it to report accurately on Google's own channels. The question of whether to trust that position is exactly the question independent measurement exists to answer.
The combination of invisible AI influence, early-stage agentic commerce, and AI platforms entering the advertising market is producing an environment where the measurement problem is harder, the financial stakes of getting it wrong are higher, and the pressure on platform-reported metrics is intensifying across a new set of channels. The impartial perspective — from a party with no financial relationship to any of the channels being measured, including AI advertising — is the only structurally credible basis for answering what AI actually contributed.
C3 Metrics Approach
C3 Metrics is tracking AI-referred traffic as a distinct, first-class channel in client programs now — establishing the baseline data before AI advertising scales. We are building agentic conversion infrastructure: the measurement architecture to capture conversions completed by AI agents, not just human browser sessions. The ORAC classification framework provides the analytical lens to surface how AI is absorbing Originator-stage activity. And our industry-specific program design reflects the reality that automotive, financial services, and short-cycle consumer categories face this problem differently — with different timing, different signal gaps, and different measurement priorities. Independent measurement with no financial relationship to AI advertising channels is not a future positioning; it is the present structural fact that makes objective answers possible.